HIVE
UX Design Approach to Digitalize AI-Driven Investment Hedge Fund
About Hive
HIVE Investment is more than just a platform; it’s a movement to redefine the investment experience for the new generation. At its core, HIVE is about empowerment—arming users with intuitive tools, AI-driven insights, and a beautifully crafted experience that transforms complex financial data into actionable clarity. From portfolio customization to real-time performance tracking, HIVE puts the power back into the hands of its users, allowing them to take control of their wealth with confidence and precision.
Challenge
Exclusivity Barrier: Traditional investment platforms often cater to older demographics, neglecting younger HNWIs.
Complexity: Financial dashboards are dense with jargon, making them overwhelming for non-experts.
Transparency Gaps: Users lack confidence in decision-making due to limited clarity on risks and rewards.
Solution
To create an engaging, user-friendly investment platform that makes young HNWIs feel included and empowered to make informed decisions confidently.
Approach
Role
  • Led User Research activities to better define the problem through Discovery
  • Led Design direction & alignment for my team
  • Ensure  Design accessibility &consistency across Web, iOS & Android user interface and interactions
Focus
  • Discovery: Unearthing user motivations and challenges to define a clear problem statement.
  • Empowerment: Designing features that give users clarity, confidence, and control over their investments.
  • Accessibility: Prioritizing inclusive design principles for a wide range of devices and abilities.
UX Strategy
💡️
Competitor Analysis: Studied industry leaders to uncover gaps and opportunities for innovation.
🕵🏼‍♂️
User Research: Engaged users and stakeholders to align goals and identify pain points.
🌟
Ideation: Brainstormed creative solutions based on user insights and business needs.
🛠
Prototypes & Design System: Built sleek, cutting-edge designs with a reusable toolkit for consistency and accessibility.
Discovery

To fully understand the problem’s statement, I looked deeply into how this problem came to be, how people are presently handling it, and how they are now dealing with it. Along with this I also tried to understand what my competitors are doing to solve this problem.

Research Goals
Understand User Needs: Identify the financial goals, motivations, and challenges of young high-net-worth individuals (HNWIs).

Uncover Pain Points: Explore frustrations with existing investment platforms, such as complexity, lack of transparency, or limited customization.

Define Success Metrics: Establish what makes an investment platform engaging, trustworthy, and valuable to the target audience.

Discover Preferences: Learn about users’ preferred tools, visual styles, and communication methods for tracking and managing investments.

Validate Features: Test the viability of potential features like AI-driven insights, diversification tools, and performance tracking.

Explore Market Gaps: Identify underserved needs in the market that can set HIVE apart from competitors.

Enhance Accessibility: Ensure the platform is inclusive and usable for diverse users across devices
Understanding the users in-depth
To gain a deeper understanding, we conducted interviews with both investment experts and non-experts. These sessions provided valuable insights, highlighting that investors prioritize factors such as prices, valuations, historical performance, overall past performance, and market trends.
Understanding the Ecosystem : How do users make investment decisions?

Investors use different financial instruments to earn a rate of return to accomplish financial goals and objectives. Investment securities include stocks, bonds, mutual funds, derivatives, commodities, and real estate.They build portfolios either with an active orientation that tries to beat the benchmark index or a passive strategy that attempts to track an index.

🕛 UX Metrics considered for measuring

Before starting with the design, I set myself a few UX metrics based on which the success rate can be calculated:

User Onboarding Success Rate: Measure the percentage of users who successfully complete the onboarding process. This metric indicates how well the design guides users through the initial setup.

User Retention Rate: Measure the percentage of users who return to the platform after the initial visit. High retention indicates a positive user experience.

Click-through Rate (CTR): Measure the percentage of users who click on specific calls-to-action or links. A high CTR suggests effective design and clear navigation.

Engagement Metrics: Track metrics like the number of logins per user per week, the number of portfolio updates, or the frequency of alert setups. High engagement suggests a valuable and sticky product.

Task Success Rate: Measure the percentage of successful task completions without errors or help-seeking behavior. This metric reflects task efficiency and effectiveness.

Wireframes

Wireframes

My Works

My Works

Services
Converting the ideas to design

With the user flow blueprint we set out to create our first iteration of mid fidelity wireframing. We started with a design studio to help brainstorm ideas for the screens we would like to create. I explored high-fidelity wireframing to refine UI concepts and validate design decisions. After testing and iterating, these final wireframes emerged as the foundation for the polished design mockups.4o

📌 Wealth Management Tool

These portfolio management systems are used by investment professionals to build, track, and manage their clients’ investment portfolios.The problems that I identified during the brainstorming sessionWhile designing the dashboard, I answered the following questions:

  • How am I gonna lay the information in the right way, so that the user can get the information they are looking for?
  • How can I reduce the user’s cognitive Load?
  • How can I show the information cleaner and better?
📌 Streamlined Onboarding for Hive Investments

The new onboarding flow ensures a smooth journey—collecting and verifying investor details, signing agreements, and selecting investment options—all in one place. With DocuSign integration, investors can securely complete the process from anywhere, making onboarding faster, safer, and more accessible.

📌 Dashboard

The Hive Investments dashboard delivers a clear, data-driven view of portfolio performance, offering insights into current holdings, past trends, and investment strategies. Designed for transparency and ease of use, it empowers investors with confidence and control over their financial decisions. Beyond functionality, the dashboard fosters a strong emotional connection between users and the Hive brand, reinforcing trust in their investment journey.

  • To help users with decision-making, I have provided them with the important data points that are required for making an investment on the dashboard screen.According to human psychology, having more visuals such as graphs, results in a faster understanding of context, and it increases the decision-making process.
  • I tried not to clutter the screen with too much information, providing users with a clean UI, helps in faster decision-making
  • According to human psychology, having more visuals such as graphs, results in a faster understanding of context, and it increases the decision-making process.
📌 Benchmarking Performance

Benchmarking performance is a process of comparing the performance of an investment portfolio, asset, or investment strategy against a relevant benchmark or market index. As Hive's goal is to empower investors to become more autonomous, it facilitates this aim by providing an investment simulator. The purpose of benchmarking performance

  • Is to assess how well an investment or portfolio has performed relative to the broader market or a specific sector.
  • It helps investors and fund managers understand whether their investment choices have outperformed or underperformed the market or the benchmark.

Here I am showcasing the benchmarking performance of stocks from the investment, a visual example of how benchmarking would look on the dashboard, and how it is an important data point and can help users with informed decision-making.

📌 Portfolio Diversity

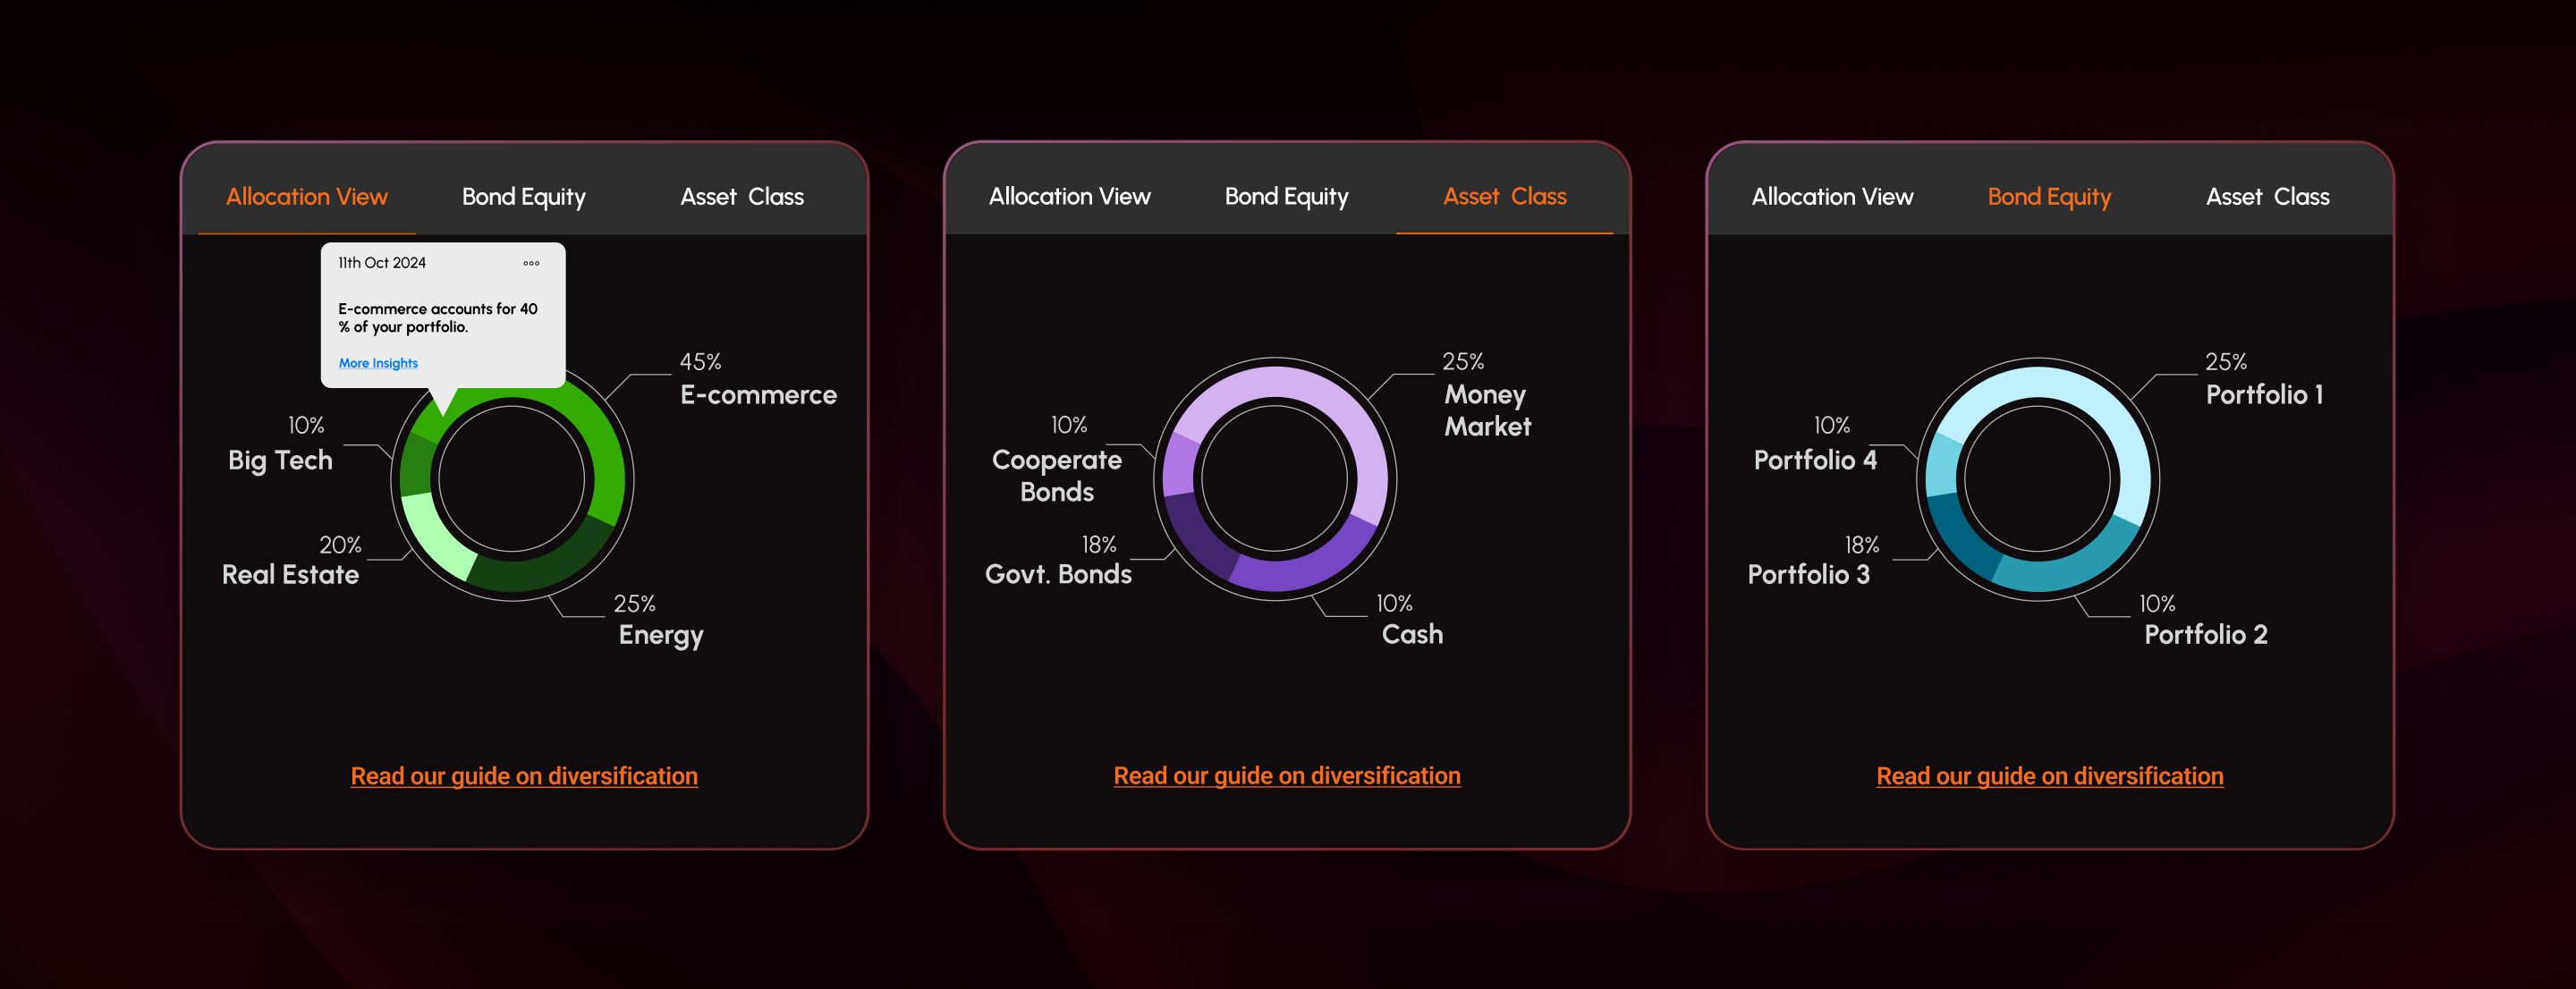
Diversification is the practice of spreading your investments around so that your exposure to any one type of asset is limited.While designing the Portfolio Diversity cards, I answered the following questions:

  • How can I lay the visual information in a better way to make it easy for users to understand?
  • What are the important data points that users consider when they are browsing about portfolio diversity?
  • Which visual indicator should I consider for showcasing all the portfolios, assets, and equity info?

Giving users the option, if they want to dive deeper and have an understanding of the portfolio diversifications, they can always click on the button below (This was added keeping in mind the beginner investors).

📌 Watchlist

A watchlist is a set of securities an investor monitors for potential trading or investing opportunities.It can be used to track stocks/funds of interest on data points like price, quality, asset value chart, and performance of the stock.

📌 Stock Sector Division

This part educates users by informing them of the sectors in which they own stocks and the percentage of their investment in that sector.

📌 Final Screens

This part educates users by informing them of the sectors in which they own stocks and the percentage of their investment in that sector.

Future Iterations
  • AI Assistantship: Using AI assistants as a knowledge base, to dig more into the investment information, they can help you make a decision based on past and present data and give a risk analysis report based on the reports processing.
  • Report saved: A repository where you can save all the important reports that you want to look into in the future, you can compare them to see the investment analysis.
  • Expert Advice: Getting advice from the expert in the field can prove to be a great help for the beginner in the field, they can seek an expert guidance to understanding what decision to make while reading the data.
  • Gamified Learning: This feature is designed for beginners entering the world of investing with no prior knowledge. Traditional tutorials, like those on YouTube, may not be enough to keep them engaged. Instead, an interactive, gamified experience allows users to learn by doing—simulating real investment scenarios, making decisions, and receiving instant feedback. This hands-on approach helps users grasp key investment concepts in a fun and effective way.
Learning
  • Simplifying Complexity Enhances AdoptionStreamlining complex financial processes, such as onboarding and portfolio management, significantly improves user engagement and reduces friction.
  • Personalization Drives Investor ConfidenceProviding AI-driven insights and tailored investment recommendations enhances decision-making and makes users feel more in control.
  • Seamless User Experience Builds TrustA well-structured UI, intuitive navigation, and clear data visualization reinforce credibility and strengthen investor-brand relationships.
  • Emotional Connection MattersBeyond functionality, a well-designed experience fosters trust, making users feel valued and connected to the platform.
  • Digital-First Onboarding is EssentialA fast, fully digital onboarding process increases accessibility, ensuring high-net-worth individuals can start investing quickly and securely.
  • Scalability and Consistency Ensure Long-Term SuccessA strong design system supports future growth, allowing for new features and seamless cross-platform experiences.
These insights highlight the importance of user-centric design in financial platforms, ensuring Hive Investments meets the evolving needs of young high-net-worth investors. 🚀
Let's work together...

GET IN

icon

TOUCH

SAY HI

Contact